ATR-Forex.com Advanced Trading Resources |

|
|
|
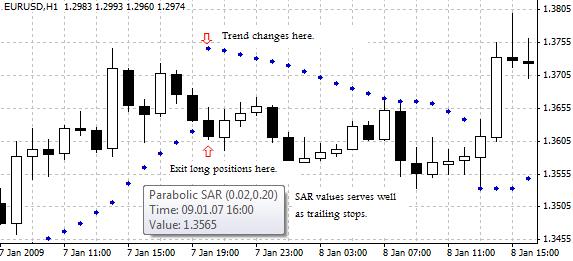
Forex Glossary Index: A | B | C | D | E | F | G | H | I | K | L | M | N | O | P | Q | R | S | T | U | V | W | Y Use Parabolic SAR in Forex TradingParabolic SAR is a very helpful technical analysis indicator for analyzing price trend. In charting, the indicator is depicted as a stop-and-reversal (SAR) line above or below price bars/candles on the price chart. On the chart below, Parabolic SAR is represented by the blue arrows. How can Parabolic SAR be used in forex trading? First, the Parabolic SAR indicator can be used for identifying trend. When price bars or candles are above the SAR line, the trend is bullish; while prices are below the SAR line, it is bearish. The indicator can be used for identifying the end of a trend or a trend reversal. When the SAR line changes from appearing below the price bars or candles to appearing above them, the end of an uptrend is indicated. Alternatively, when the SAR line moves from above the price bars or candles to below them, the end or reversal of an downtrend is indicated. Similarly, exit points can be discovered with the Parabolic SAR indicator. Long positions are supposed to be closed when the price breaks below the SAR line, while short positions are supposed to be closed when the price breaks above the SAR line. Another approach to apply the indicator in forex trading is to use the SAR values as trailing stops. Normally, the SAR values can be obtained by pointing the computer mouse arrow at the SAR symbols (the blue arrows on the example chart below) on the chart software. The SAR line is also often used for the purpose of trailing stop in forex trading.
Related topics: How to Use Commitments of Traders Report (COT) in Forex Trading How to Choose a Best Forex Broker How to Perform Fundamental Asnalysis in Forex Trading How to Perform Technical Analysis in Forex Trading Measuring Sentiment in Forex Trading Approaches of Risk Management in Forex Trading
A | B | C | D | E | F | G | H | I | K | L | M | N | O | P | Q | R | S | T | U | V | W | Y |
| ©2008-2013 ATR-Forex.com. All Rights Reserved. | Home | About Us | Advertising | Site Map | Contact Us | Disclaimer | Risk Warning |