Forex Glossary Index:
A | B | C | D | E | F | G | H | I | K | L | M | N | O | P | Q | R | S | T | U | V | W | Y
Technical Analysis: Chart Patterns for Forex Trading
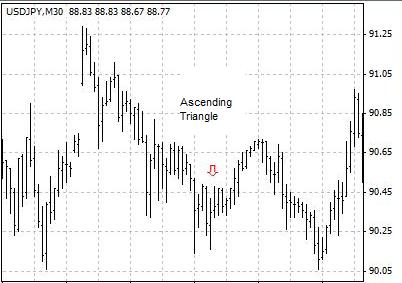
Ascending Triangle - A triangle chart pattern of sideways movement in technical analysis. An ascending triangle looks like a triangle with the upper boundary parallel to the horizontal axis and the lower boundary tilts up in charting.
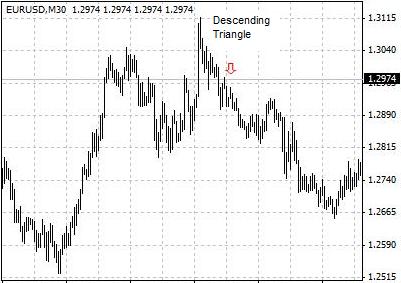
Descending Triangle - A triangle chart pattern of price movement in technical analysis. A descending triangle looks like a triangle with the lower boundary parallel to the horizontal axis and the upper boundary tilts down in charting.
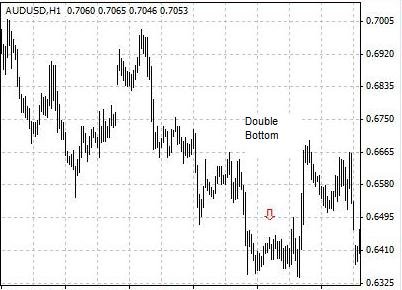
Double Bottom - A chart pattern in technical analysis describing the situation that the prices rise after falling twice to about the same level in a "W" shape. A double bottom is normally considered a bullish reversal signal.
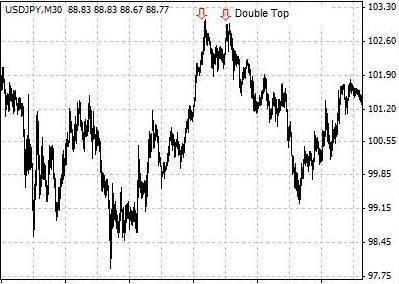
Double Top - A chart pattern technical analysis the situation that the prices fall after rising twice to about the same level in a "M" shape. A double top is normally considered a bearish reversal signal.
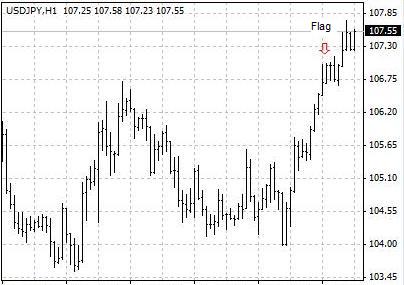
Flag - A chart pattern of price consolidation in technical analysis. A flag chart pattern looks like a flag on the chart, with a flag-pole representing the main trend and a flag representing sideway price movement.
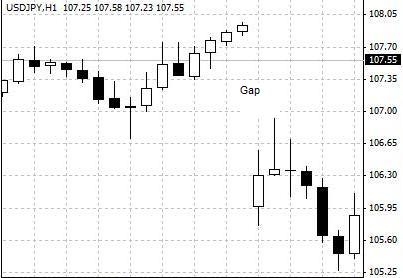
Gap - A chart pattern of technical analysis in which the price range of a bar or candle is completely above or below that of the preceding bar or candle. A gap chart pattern is not as common in forex market as in other financial markets.
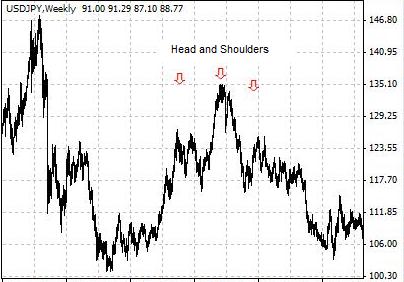
Head and Shoulders - A chart pattern which is generally considered indicating price trend reversal in technical analysis. Resembling a human head with two shoulders, a head and shoulders pattern consists of a left and a right shoulder (two lower peaks), a head (a peak higher than both shoulders), and a neckline (the support level). Breaking of the neckline of a head and shoulders chart pattern normally indicates trend reversal and thus a selling opportunity. This chart pattern is also referred to as a head and shoulders top. The upside-down formation of a head and shoulders top is called a head and shoulders bottom, inverse head and shoulders, or reverse head and shoulders.
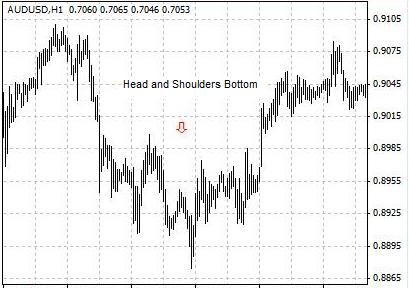
Head and Shoulders Bottom - The upside-down chart formation of a head and shoulders top. Breaking of the neckline of a inverse head and shoulders normally indicates reversal of a current downtrend and thus a buying opportunity. It is also called an inverse head and shoulders, or reverse head and shoulders.
Head and Shoulders Top – A chart pattern which is generally considered indicating price trend reversal in technical analysis. Resembling a human head with two shoulders, a head and shoulders pattern consists of a left and a right shoulder (two lower peaks), a head (a peak higher than both shoulders), and a neckline (the support level). Breaking of the neckline normally indicates trend reversal and thus a selling opportunity.
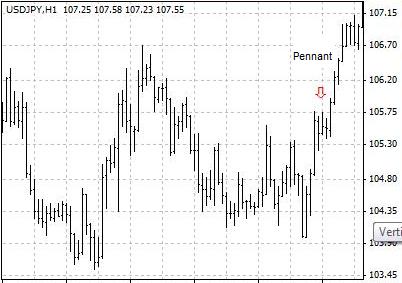
Pennant - A chart pattern of price consolidation in technical analysis. It looks like a pennant on the chart, with a vertical line representing the main trend and a small triangle at the top representing sideways price movement.
Triangle – A chart pattern of price movement in technical analysis. A triangle chart pattern looks like a triangle, with price ranges gradually narrowing down.
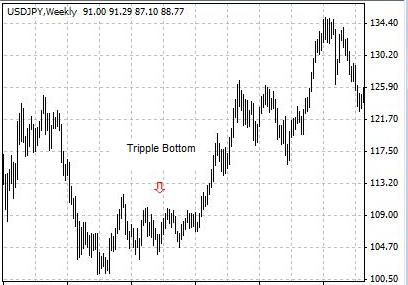
Triple Bottom - A chart pattern in technical analysis describing the situation that the prices rise after falling three times to about the same level in a "W" shape. A triple bottom is normally considered a bullish reversal signal.
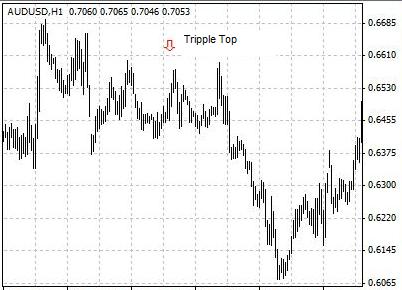
Triple Top - A chart pattern in technical analysis describing the situation that the prices fall after rising three times to about the same level in a "M" shape. A triple top is normally considered a bearish reversal signal.
Site Index:
A | B | C | D | E | F | G | H | I | K | L | M | N | O | P | Q | R | S | T | U | V | W | Y
|
