ATR-Forex.com Advanced Trading Resources |

|
|

|
技术分析:汇市K线图型态组合K线图,烛台图,阴阳线图(Candlestick Charts) ― 一种首先在日本开始使用的图表方法,这种图表采用蜡烛模样的图形来显示市场价格的变动。在K线图中,一个矩形(称为实体或烛身)代表开盘价与收盘价之间的差别。一条直线代表最高价与最低价之间的幅度,称为影线。如果收盘价高于开盘价,实体为白色、绿色、或不被填充;如果开盘价高于收盘价,实体为红色、黑色、或被填满。
看跌吞没、 空头吞噬(Bearish Engulfing) — 此K线图型态描绘在一个上升的趋势中,一根阳线之后,出现一根实体更长的阴线。看跌吞没表明价格变动可能向下逆转。
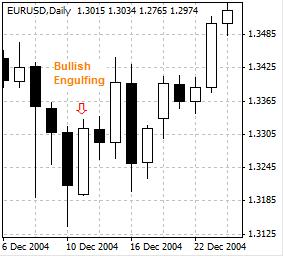
看涨吞没、多头吞噬、破脚穿头(Bullish Engulfing) — 此K线图型态描绘在一个下降的趋势中,一根阴线之后,出现一根实体更长的阳线。看涨吞没表明价格变动可能向上逆转。
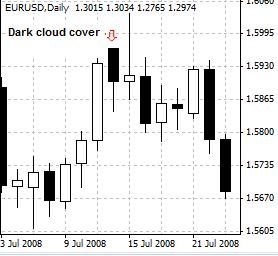
乌云盖顶(Dark Cloud) — 此K线图型态描绘在上升的趋势中,一根K线高开、但收盘价却低于前一根K线的中位数;也就是说,在一组阳线之后,出现一根阴线。乌云盖顶被视为看跌反转信号。
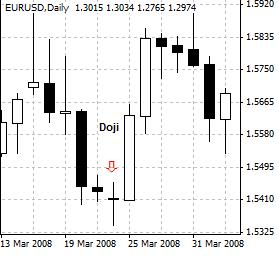
十字线(Doji)— 只有上下影线,没有身体的K线图型态,表明开盘后价格先后上扬、下跌,但收盘价与开盘价相等。
十字线星(Doji Stars) — 此K线图型态包括一个跳空的十字线。其中又分十字线晨星和十字线夜星。
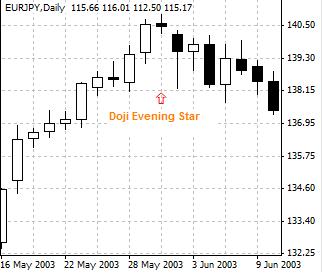
十字线夜星(Evening Doji Stars) — 由三根线组成的看跌反转K线图型态。第一根线是阳线,第二根线是高于第一根线的十字线,第三根线是阴线,其收盘价低于第一根阳线实体(烛身)的中位数。又见十字线晨星。
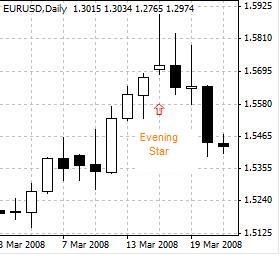
夜星、昏星(Evening Stars) — 由三根线组成的看跌反转K线图型态。第一根线是阳线,第二根线实体较短、但是高于第一根线,第三根线是阴线,其收盘价低于第一根阳线实体(烛身)的中位数。与晨星相反。
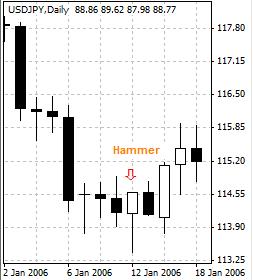
锤子型态(Hammer) – 锤子型态为一根下影线很长、实体较短的K线,出现在下降趋势中。一般情况下,为看涨反转信号。
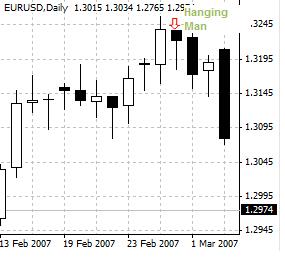
吊人型态(Hanging Man) ― 吊人型态为一根下影线很长、实体较短的K线,出现在上升趋势中。一般情况下,为看跌反转信号。吊人型态表面上看起来像锤子型态,但它出现在上升趋势中,而锤子型态则出现在下降趋势中。
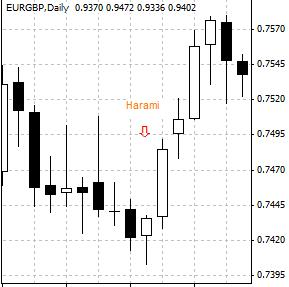
包孕线(Harami)— 包孕线型态描绘的是后一根K线较短的实体,完全包含在前一根K线较长的实体中, 而且这两根K线颜色相反,一阳一阴。 包孕线型态为趋势反转型态。
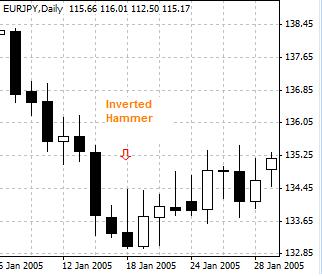
倒锤(Inverted Hammer) — 倒锤型态为一根上影线很长、实体较短的K线,出现在下降趋势中。一般情况下,为看涨反转信号。
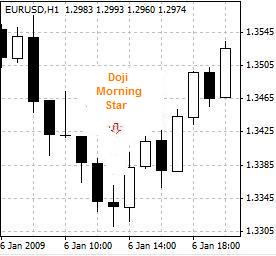
十字线晨星(Morning Doji Star|) – 由三根线组成的看涨反转K线图型态。第一根线是阴线,第二根线是低于第一根线的十字线,第三根线是阳线,其收盘价高于第一根阴线实体(烛身)的中位数。与十字线夜星相反。
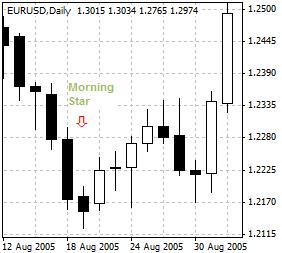
晨星(Morning Star) — 由三根线组成的看涨反转K线图型态。第一根线是阴线,第二根线实体较短、但是低于第一根线,第三根线是阳线,其收盘价高于第一根阳线实体(烛身)的中位数。与夜星相反。
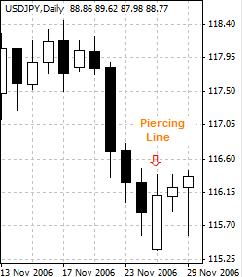
上冲线(Piercing Line) — 一种下降趋势中的看涨反转K线图型态。此型态包括两根K线,前一根K线是长阴线,后一根K线为跳空低开的长阳线;后一根K线的收盘价高于前一根K线实体(烛身)的中位数。
流星、射击之星(Shooting Star) – 此型态为一根实体较短、上影线很长的K线。它出现在上升趋势中,一般为看跌的警示信号。
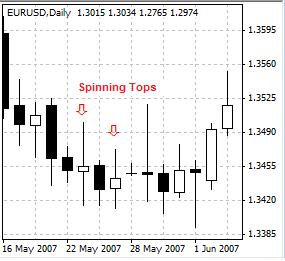
纺纱顶(Spinning Tops) — 此型态为一根实体较短、上下影线较长的K线。一般情况下,表明价格将横向整理。
星型(Stars) – 星型K线图型态由一根烛身很短的K线与前一根K线组成,后一根K线的收盘价不在前一根K线实体的价格范围之内。其中又分晨星和夜(昏)星。
|